How to Activate WordPress Debugging – Enable WP_DEBUG and Debug Log
June 17, 2024
This tutorial has moved to the new WP Ghost Knowledge Base where each feature is presented in detail.
- When You Need WordPress Debugging
- Step 1 – Access Your wp-config.php File
- Step 2 – Add the Debugging Constants
- What Each Constant Does
- Step 3 – Save and Upload
- Step 4 – Review the Debug Log
- Step 5 – Disable Debugging After Troubleshooting
- Why Debugging Is a Security Risk on Live Sites
- Frequently Asked Questions
Enable WordPress debugging to log PHP errors and warnings to a debug.log file. Add four constants to wp-config.php: WP_DEBUG, WP_DEBUG_LOG, WP_DEBUG_DISPLAY, and SCRIPT_DEBUG. Always disable debugging after troubleshooting to avoid exposing error details to attackers.
When You Need WordPress Debugging
WordPress debugging mode captures PHP errors, warnings, and notices that are normally hidden. This is essential when you need to troubleshoot a white screen of death, a plugin conflict, a broken theme, unexpected behavior after an update, or issues with WP Ghost configuration. The debug log records exactly what went wrong and where, which helps you or your developer fix the issue quickly.
Debugging is a temporary diagnostic tool. It should be enabled for troubleshooting only and disabled as soon as you have identified the problem. Leaving debugging active on a live site is a security risk because the debug.log file can contain sensitive information like database queries, file paths, and error details that attackers can use.
WP Ghost’s Security Check flags active debugging as a security issue. If you see this warning, it means WP_DEBUG is enabled on your live site and should be turned off.
Step 1 – Access Your wp-config.php File
The wp-config.php file is located in the root directory of your WordPress installation, the same folder that contains wp-admin, wp-content, and wp-includes.
1. Connect to your server using sFTP or your hosting File Manager.
2. Navigate to the WordPress root directory.
3. Open wp-config.php in a text editor.
Step 2 – Add the Debugging Constants
4. Look for the line that says /* That's all, stop editing! Happy blogging. */.
5. Just above that line, add the following code:
// Enable WP_DEBUG mode
define( 'WP_DEBUG', true );

// Enable Debug logging to the /wp-content/debug.log file
define( 'WP_DEBUG_LOG', true );

// Disable display of errors and warnings on the frontend
define( 'WP_DEBUG_DISPLAY', false );
@ini_set( 'display_errors', 0 );

// Use dev versions of core JS and CSS files (optional, for core development only)
define( 'SCRIPT_DEBUG', true );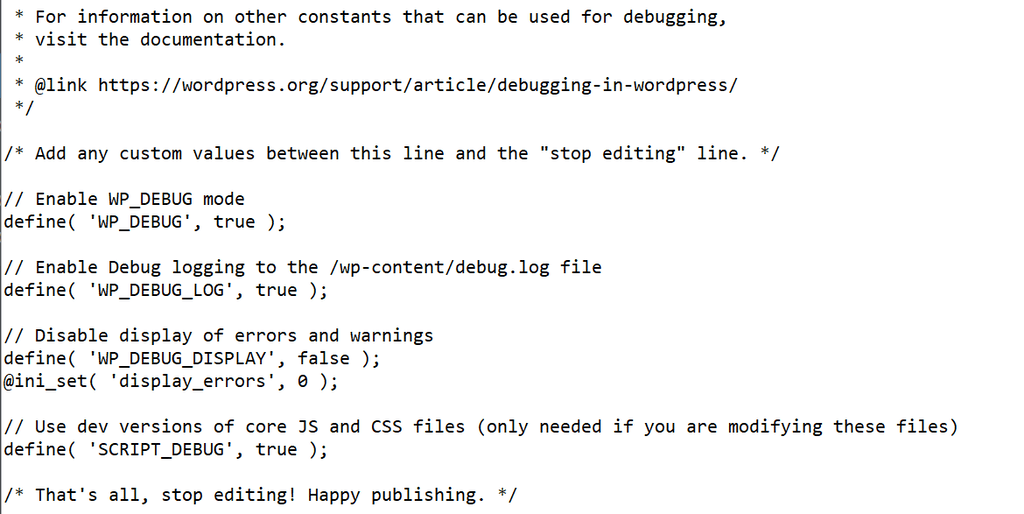
If these constants already exist in your wp-config.php, change their values instead of adding duplicates. WordPress only reads the first definition of each constant.
What Each Constant Does
WP_DEBUG is the master switch. Setting it to true activates debugging mode across your entire WordPress installation. All PHP errors, warnings, and notices will be captured.
WP_DEBUG_LOG tells WordPress to write all errors to a file called debug.log inside the wp-content directory. Without this, errors are only shown on screen (or not at all). The log file is persistent, so you can review errors after they happen.
WP_DEBUG_DISPLAY controls whether errors appear in the HTML output of your pages. Setting it to false prevents visitors from seeing PHP error messages on your site. The @ini_set('display_errors', 0) line reinforces this at the PHP level. Always set this to false on live sites.
SCRIPT_DEBUG forces WordPress to load the full, non-minified versions of core JavaScript and CSS files instead of the compressed versions. This is only useful if you are debugging core WordPress JavaScript or CSS. For most troubleshooting, you can skip this constant.
Step 3 – Save and Upload
6. Save the wp-config.php file.
7. Upload it back to your server if you edited it locally.
8. Visit your site and reproduce the issue you are troubleshooting. The error will be logged to the debug.log file.
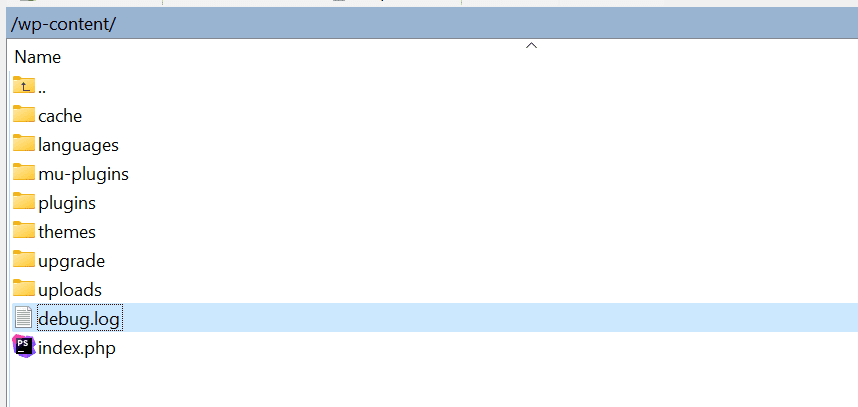
Step 4 – Review the Debug Log
9. Navigate to the wp-content directory on your server.
10. Open the debug.log file. If it does not exist yet, visit your site first. WordPress creates the file when the first error occurs.
11. Look for entries that match the time you reproduced the issue. Each entry includes a timestamp, the error type (notice, warning, fatal error), the error message, and the file path and line number where it occurred.
12. Use the file path and error message to identify which plugin, theme, or core file is causing the problem.
Step 5 – Disable Debugging After Troubleshooting
This step is critical. Once you have identified the problem, disable debugging immediately.
13. Open wp-config.php again.
14. Change the debugging constants back to their safe values:
define( 'WP_DEBUG', false );
define( 'WP_DEBUG_LOG', false );
define( 'WP_DEBUG_DISPLAY', false );
define( 'SCRIPT_DEBUG', false );
15. Save and upload the file.
16. Delete the debug.log file from wp-content. This file may contain sensitive paths, database query information, and error details that attackers can exploit.
Why Debugging Is a Security Risk on Live Sites
The debug.log file can contain your full server file paths, database table names, plugin and theme names (even if hidden by WP Ghost), PHP version and configuration details, and SQL query errors that reveal database structure. If an attacker can access wp-content/debug.log (which is a known WordPress path), they gain information that makes targeted attacks easier.
WP Ghost helps protect the debug.log file in two ways. It hides the wp-content directory path (so bots can not guess where debug.log is located), and it can block direct access to common files including debug.log. However, the safest approach is to not have a debug.log file on your live site at all.
WP Ghost’s Security Check includes a task that verifies whether WP_DEBUG is disabled. If the scan flags this, open wp-config.php and set WP_DEBUG to false. WP Ghost Premium can fix this for you with the one-click Fix it button in the Security Check results.
Frequently Asked Questions
Where is the debug.log file located?
By default, it is located at /wp-content/debug.log. If you are using WP Ghost with a custom wp-content path, the file is still in the actual wp-content directory on the server (WP Ghost does not physically move files). You can also define a custom log location by setting WP_DEBUG_LOG to a file path instead of true, for example: define('WP_DEBUG_LOG', '/home/user/logs/debug.log');
Can I enable debugging without showing errors to visitors?
Yes. Set WP_DEBUG_DISPLAY to false and WP_DEBUG_LOG to true. Errors will be written to the debug.log file silently without appearing in your page HTML. This is the recommended configuration for debugging on live sites.
Do I need SCRIPT_DEBUG for most troubleshooting?
No. SCRIPT_DEBUG forces WordPress to load uncompressed JavaScript and CSS files. This is only useful if you are debugging core WordPress scripts or stylesheets. For most plugin and theme troubleshooting, WP_DEBUG and WP_DEBUG_LOG are sufficient. Skip SCRIPT_DEBUG unless you have a specific reason to enable it.
Will debugging affect my site performance?
Yes, slightly. With debugging enabled, WordPress captures and logs every PHP notice, warning, and error. On sites with many plugins, this can generate a large debug.log file and add minor processing overhead. This is another reason to disable debugging as soon as you are done troubleshooting.
WP Ghost Security Check says debugging is active. How do I fix it?
Open wp-config.php and set define('WP_DEBUG', false);. Also set WP_DEBUG_LOG and WP_DEBUG_DISPLAY to false. Delete any existing debug.log file from wp-content. Run the Security Check again to confirm the issue is resolved. WP Ghost Premium users can click the Fix it button in the Security Check results to disable debugging automatically.
Does WP Ghost modify WordPress core files?
No. WP Ghost uses server rewrite rules and WordPress hooks. No core files are moved, renamed, or modified. Deactivating the plugin restores all default paths instantly.